Today I had trouble debugging a Rest endpoint in a Spring Boot application.
The Problem
To start the debugger from the IDE, I simply right-clicked the main method and ran the debugger:

Despite getting all the logs for the scheduled tasks and no error messages, I couldn’t hit the breakpoint in my endpoint method.
Realisation
Eventually I noticed that Tomcat wasn’t logging its initialisation. Therefore, I was missing this line from the logged messages:
INFO 4447 --- [ main] s.b.c.e.t.TomcatEmbeddedServletContainer : Tomcat initialized with port(s): 8050 (http)
Solution
The plugin
It took just a few minutes googling to come across Spring Boot Maven Plugin.
In pom.xml
Add the plugin:
<plugin>
    <groupid>org.springframework.boot</groupid>
    <artifactid>spring-boot-maven-plugin</artifactid>
    <configuration>
        <jvmarguments>
            -Xdebug -Xrunjdwp:transport=dt_socket,server=y,suspend=y,address=5005
        </jvmarguments>
    </configuration>
</plugin>
In the console
To prepare the application for debugging, run:
mvn spring-boot:run
The app at this stage will halt execution until the debugger is attached to it:
[INFO] Attaching agents: []
Listening for transport dt_socket at address: 5005
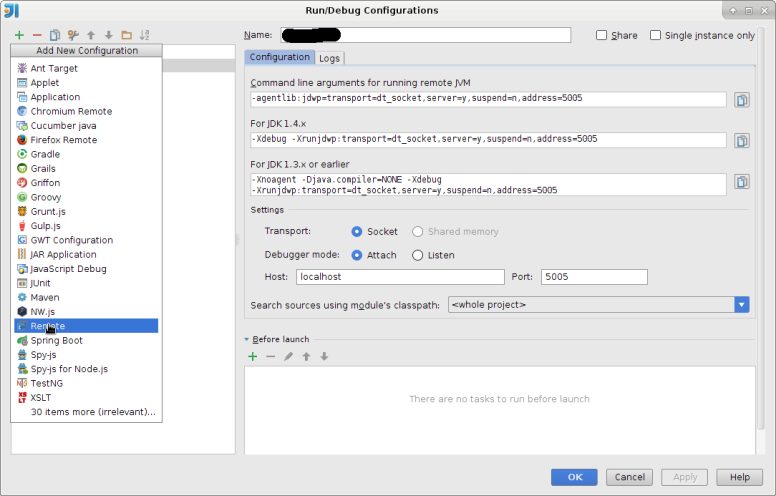
In the IDE
Add a new remote debugger making sure of using the same port the plugin broadcasts on.
That is it. Now the endpoints are running on debug mode.
